Dashboards and Reports for Podio
Visualize your organization's core metrics. Turn your company into a data-driven enterprise.
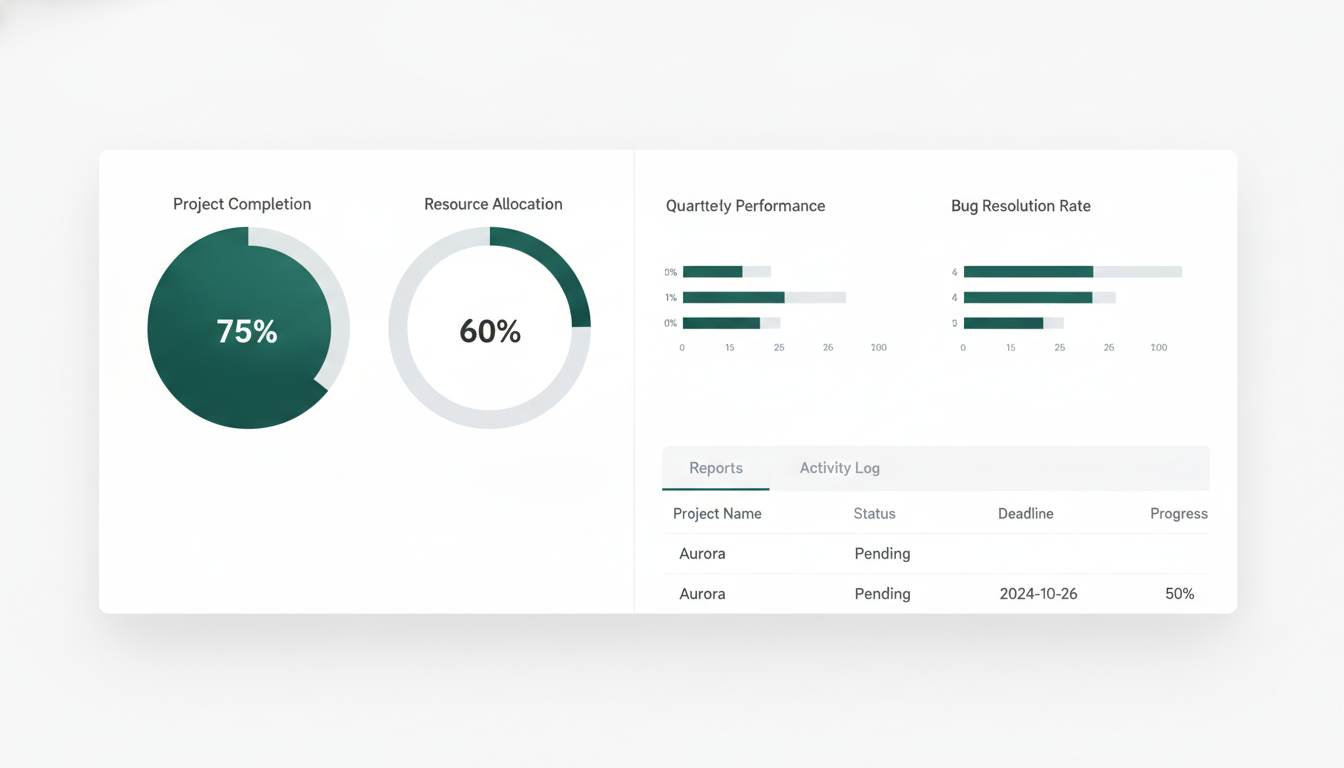
Overview is a fully customizable data visualisation tool which extracts all of your business KPI's and metrics from Podio and displays them in real-time on your personalized dashboards.
You can view and analyze any of your data from Podio in any form or color with over 20 chart types like Pie, Donut, Area, Spline, Funnel, Gauge, Column and many more.
Add to that the ability to combine scattered data from all over Podio into a single chart and what you get is a powerful decision making tool with all your KPI's in one place.
You can have custom dashboards for any employee or department and provide them with limited access accounts, based on their security clearance level. This will enable everyone access to real-time indicators that will boost their productivity and help them make more informed decisions.
With Overview you will get a better understanding of your business as a whole and also have a complete view on the impact of each of your staff member's current activity, projects or tasks.
You can even have a large screen TV dashboard configured for your watercooler area, which will be the main attraction and will give a high level of transparency between your staff, make them collaborate, reach common goals and increase your KPI's.
Our Features include
- Real-time Dashboards with any data from Podio
- Aggregated data from over 60 of the most popular sources like Facebook, Twitter, Quickbooks, Google Analytics, Mailchimp, Wordpress, Website, Database, etc.
- Scheduled Reports received in PDF format via email or Podio
- Browser based platform that can be accessed from any device (Desktop / Tablet / Mobile)
- TV Mode feature that enables data visualization on big screens
- Over 20 types of Custom Reports
- Custom built reports — we will build any report that you require with the help of our specialized Podio developers
- Historical data — analyze past data in your Podio business
- Multiple users and role based access
- Stacked reports — combine many reports into one
How it works
Connect Podio
Overview pulls your KPIs and metrics straight from your Podio apps.
Add external data
Aggregate from 60+ sources — Google Analytics, QuickBooks, Mailchimp, Facebook, your website and database.
Build dashboards
Pick from 20+ chart types — pie, donut, area, spline, funnel, gauge, column — and stack reports into one.
Share & schedule
Cast to TV mode for the office screen, or send scheduled PDF reports by email or into Podio.
Pulls data from where your business already lives.
Beyond Podio, Overview aggregates data from 60+ popular sources, including:
- Podio
- Google Analytics
- QuickBooks
- Mailchimp
- WordPress
- Website
- Database
- and 50+ more
Pricing
- No Contract
- Cancel Anytime
- All Features included
Get control over your Podio Business Data!
Turn scattered Podio data into clear, real-time dashboards your whole team can act on.